He Pūrongo Pūtea Finances at a Glance
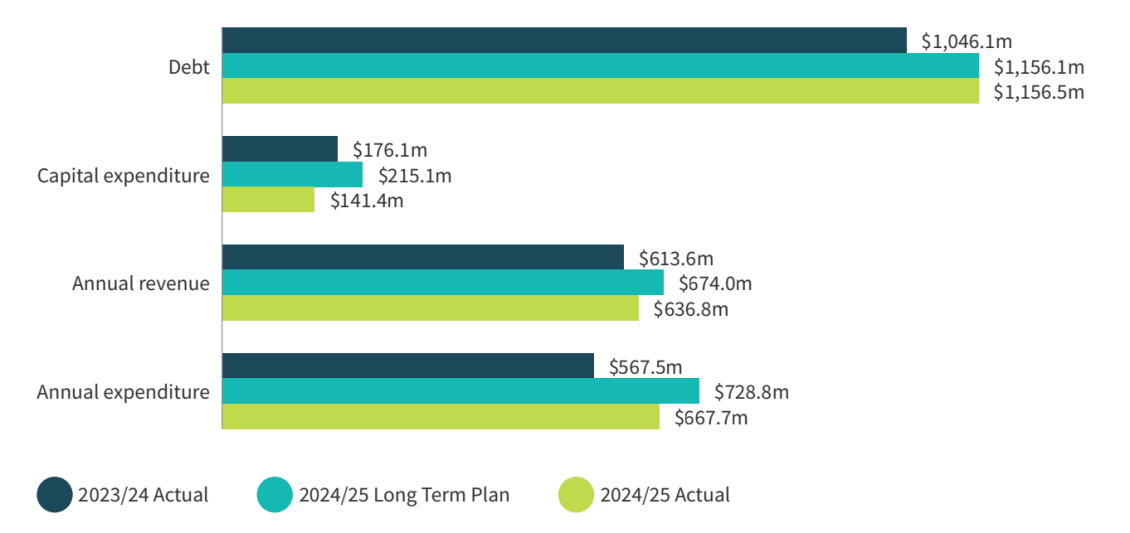
This year has been defined by persistent financial pressures, market volatility, and rising costs and this is reflected in the financial results of Greater Wellington. Full year financial performance shows a significant underspend in the capital programme delivery. Revenue has been below budget, primarily within Metlink, and this has been offset by lower spending in both the related capital programmes and operating expenditure.
- We received an AA rating with negative outlook from Standard & Poor’s, which indicates capability to honour financial commitments and uphold financial resilience.
- The cost of delivering all our services amount to 8.19 dollars per rating unit per day.
- Our total assets held this year were worth 2.69 billion.
Financial overview
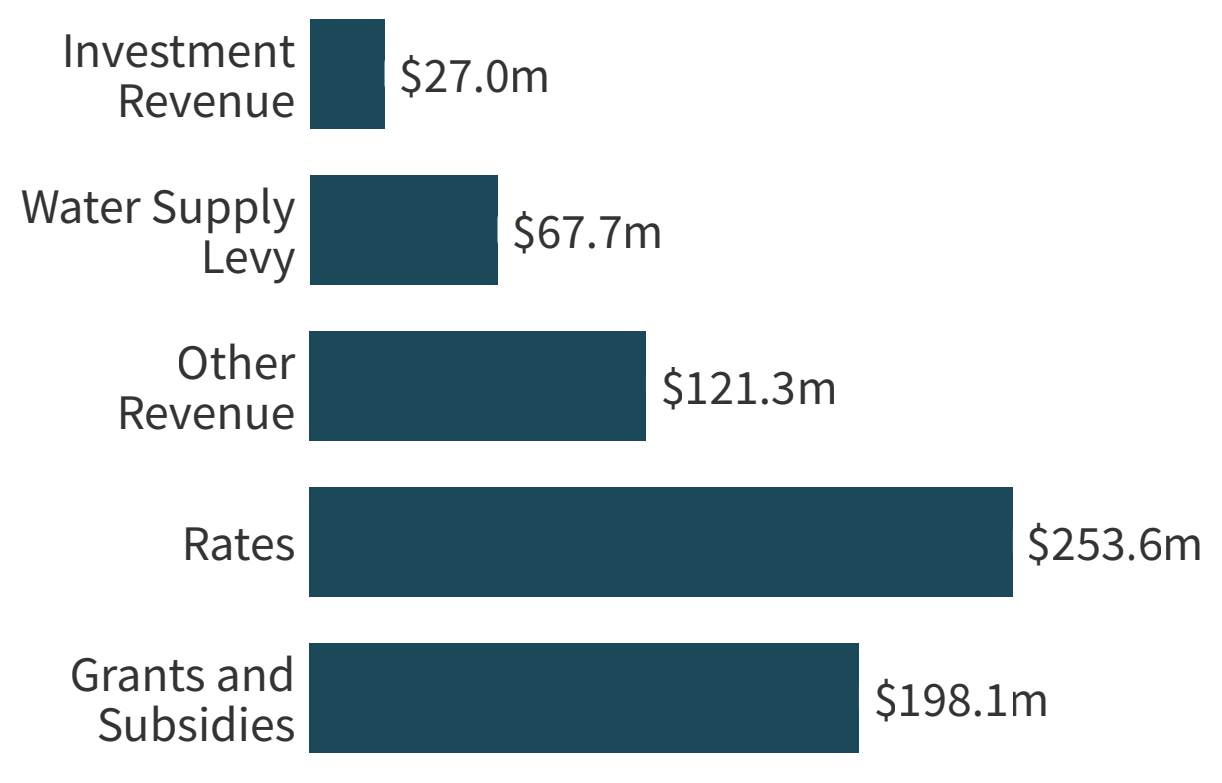
Revenue
Greater Wellington’s revenue is sourced primarily through rates and grants from central government. Other revenue sources include water supply levy, fees, charges, and investment incomes.
Revenue
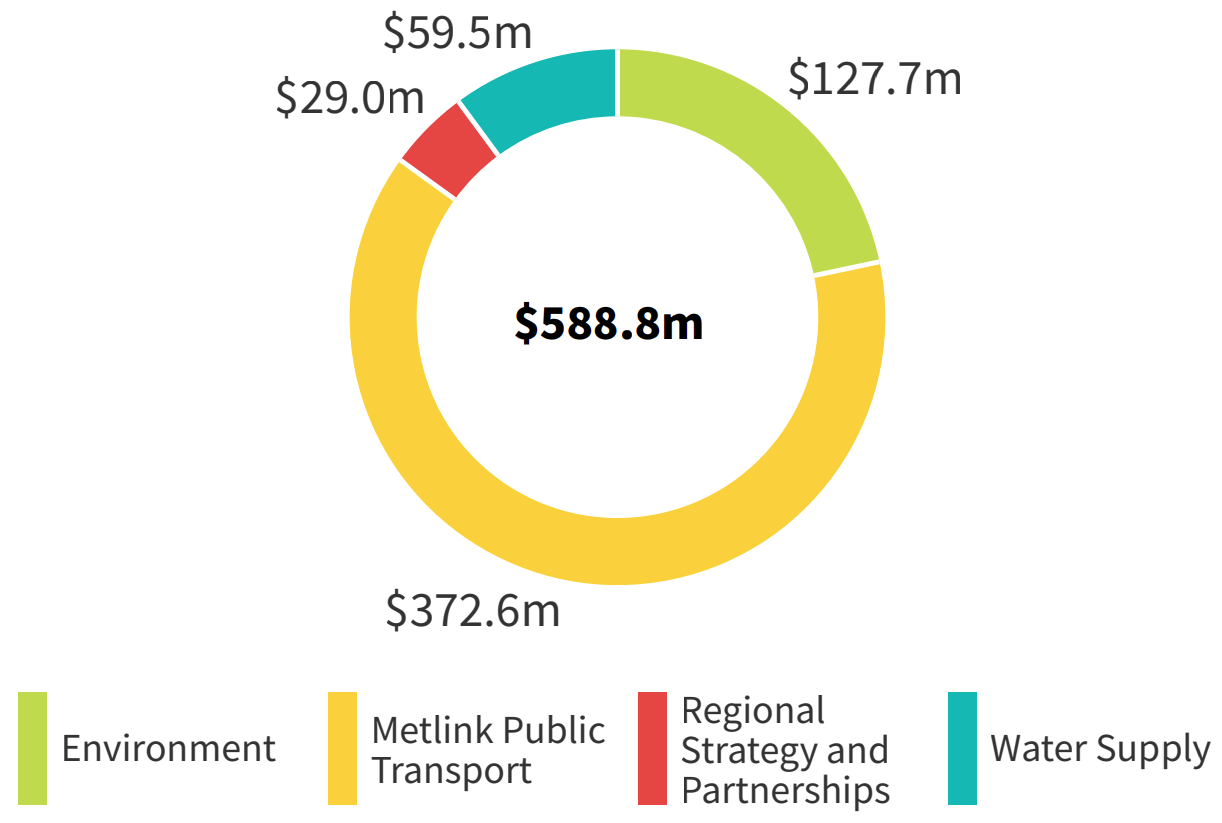
Operational expenditure
Greater Wellington’s operational expenditure across the four LTP Activity Groups, including operational costs such as staff and supplies.
Operational expenditure by Activity Group
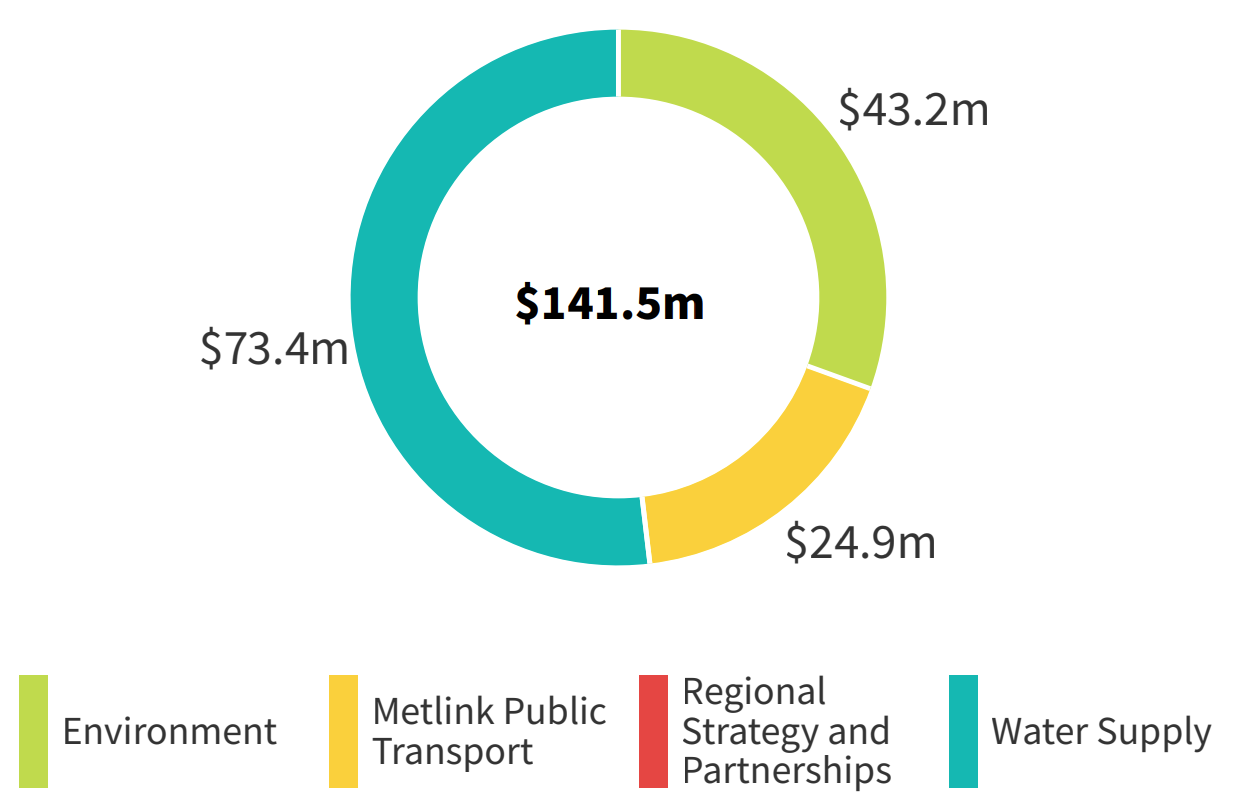
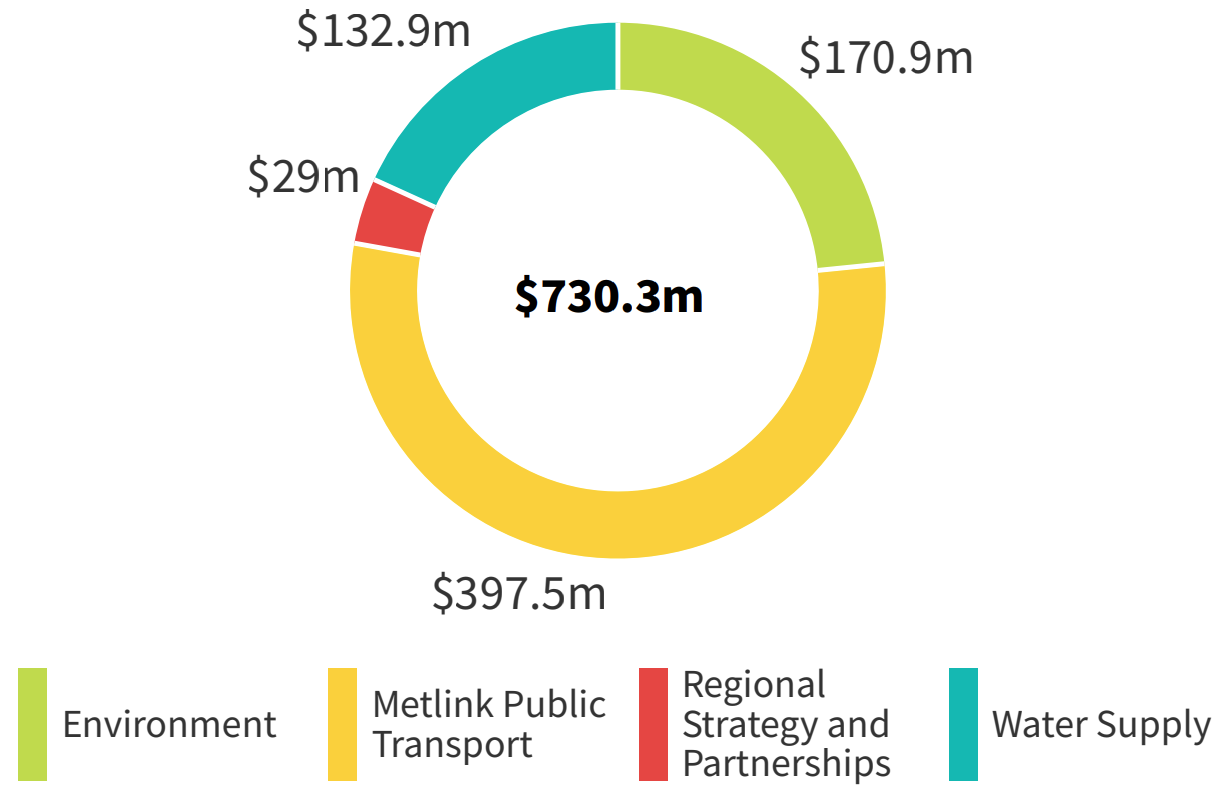
Capital expenditure
Greater Wellington’s capital expenditure across the four LTP Activity Groups, including infrastructure investment in public transport, flood protection, water supply, and parks and forests.
Capital expenditure by Activity Group
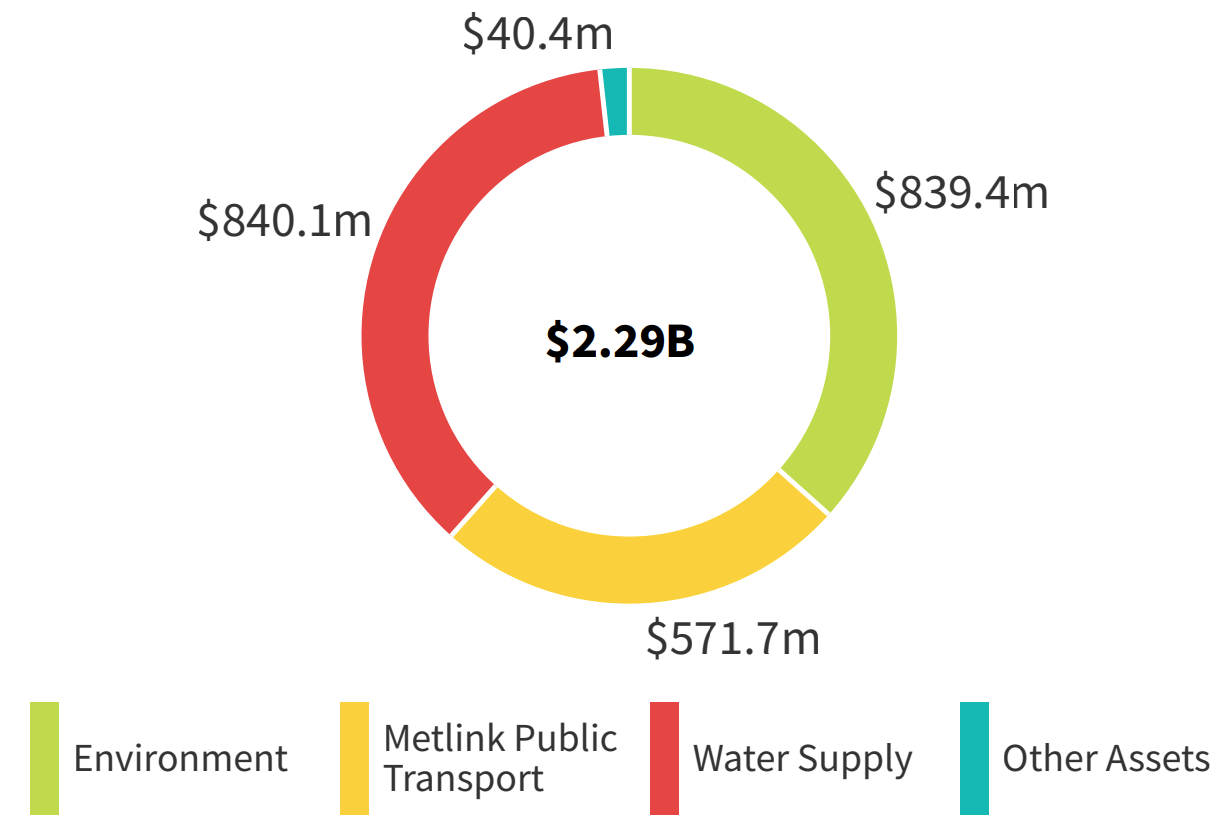
Property, plant, and equipment
Greater Wellington’s asset base comprising public transport, flood protection, water supply, and parks. Public transport includes rail rolling stock and railway station infrastructure owned by Greater Wellington Rail Limited, a council subsidiary.
Property, plant, and equipment asset value by Activity Group
Total expenditure
Greater Wellington’s total expenditure (operational plus capital) by LTP Activity Group
Total expenditure by Activity Group
Full details on our financial service performance information can be found in Wāhanga tuatoru: He pūrongo pūtea | Section three: Financial performance of the full 2024/25 Annual Report.
Pūrongo ā tau | Annual Report 2024/25
date_range Published 05 Nov 2025
Download now (PDF 18 MB) get_app