He whakarāpopototanga o te tiro whānui i te rawa Summary of Non-financial performance
Greater Wellington reports against 58 non-financial performance measures in the Annual Report. These measures were set during the preparation of the 2024-34 Long-term Plan.1
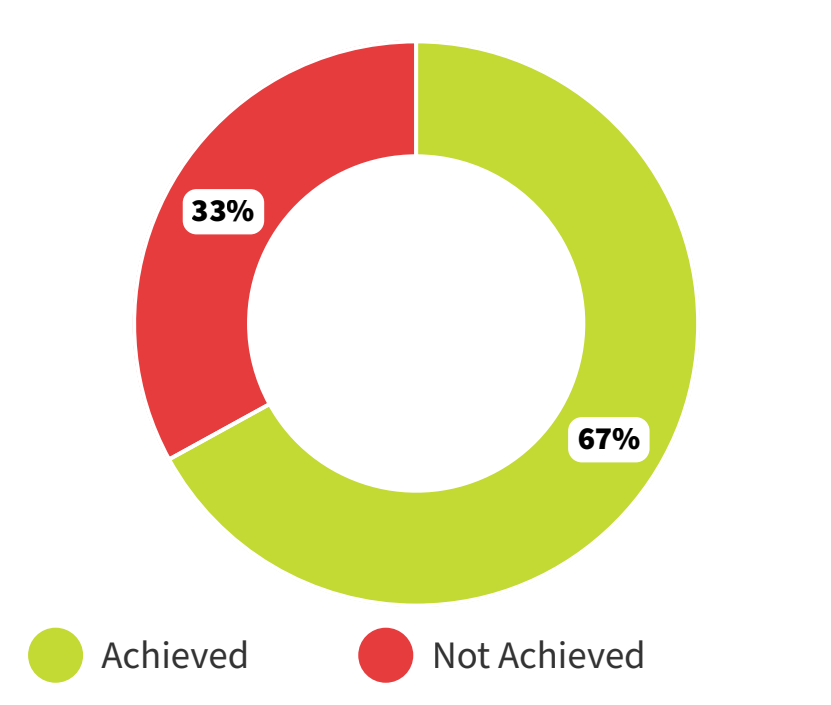
Overall, Greater Wellington achieved 67 percent (39) of the non-financial performance measures and did not achieve 33 percent (19) of the measures. In 2023/24 we achieved 64 percent (32) of the non-financial performance measures and did not achieve 36 percent (18) of the measures.
Overall 2024/25 status of LTP non-financial measures
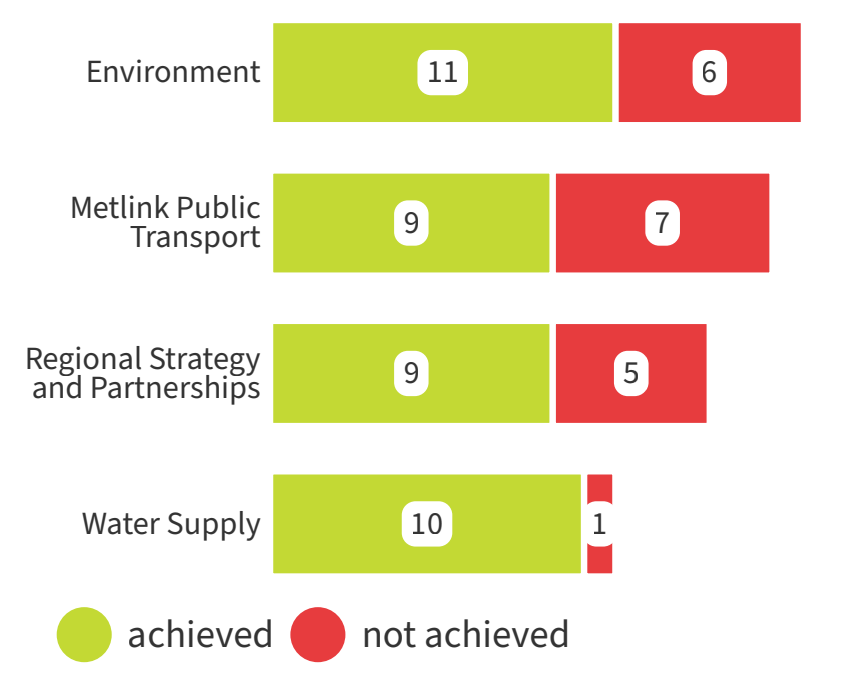
2024/25 status of LTP non-financial measures by Activity Group
Challenges in our operating environment impacted our ability to achieve in some areas
- National Land Transport Plan funding shortfalls affecting public transport infrastructure and service delivery.
- Pressure to meet private share targets and reduce rates while managing cost escalations.
- Rail service disruptions due to infrastructure decline, industrial action and staffing shortfalls.
- Resourcing challenges and increased demands from Local Water Done Well adjustments.
- Legislative changes and government reforms created uncertainty in long-term planning.
- Riverlink and National Ticketing projects faced challenges due to external dependencies.
Several ‘Not Achieved’ measures were very close to their target
- Maintaining and operating our navigation aids achieved 99.9 percent against a 100 percent target.
- Passengers' overall satisfaction rating for Metlink’s ferry services was 96 percent against a target of 98 percent; information currently available across all services was 83 percent against 85 percent; public transport being on time across all services was 78 percent against greater than 80 percent.
- Passengers' satisfaction with Metlink information currently available was 83 percent, against a target of 85 percent.
- Passenger satisfaction with Metlink public transport being on time was 78 percent, against a target of 80 percent. Satisfaction with buses specifically increased by 7 percent from the previous year.
- Logged official information requests responded to in accordance with statutory deadlines was 98.09 percent against a target of 100 percent, and compared to a national average of 97.8 percent according to the Public Services Commission
We still achieved a lot this year
- We treated 746 ha of erosion prone land against a target of 700 ha to prevent sediment from entering streams and estuaries to maintain or enhance water quality.
- We have continued to reduce the organisation’s gross (greenhouse gas) emissions compared to our 2018/19 base year.2 The carbon footprint of the bus network has reduced, as the proportion of service kilometres travelled by electric buses increased relative to diesel buses.
- Had the highest ever monthly bus patronage recorded in March 2025 with 2.59 million bus passenger boardings.
- We progressed upgrades to the Te Mārua bulk water treatment facility completed on time, allowing the plant to treat and supply an additional 20 million litres of drinking water per day.
Full details on our non-financial service performance information can be found in Section Two: He tiro whānui i te rawa | Non-financial performance of the full 2024/25 Annual Report.
Pūrongo ā tau | Annual Report 2024/25
date_range Published 05 Nov 2025
Download now (PDF 18 MB) get_app1 Twenty-two performance measures were newly created or modified for the 2024-34 Long Term Plan with a total of 58 performance measures reported on for this Annual Report 2024/25 compared to a total of 50 performance measures reported on for the previous Annual Report 2023/24.
2 There is a level of inherent uncertainty in reporting GHG emissions, due to the inherent scientific uncertainty in measuring emissions factors, as well as estimation uncertainty in the measurement of activity quantity data as disclosed on pages 27-31 of the full Annual Report. Greater Wellington is working to improve data quality and controls over the measurement of GHG emissions which may lead to lower estimation uncertainty in the future.